Catégorie : Non classé

  • Isaac, la pomme et l’IA

    Notre collègue du Cnam, Stéphane Natkin, Prof émérite, suite à l’écoute sur France Inter de Madame Virginie Schwarz, directrice de Météo France à propos du remplacement des modèles mathématiques de prévision par des modèles d’IA… a imaginé ce petit conte. Pierre Paradinas & Thierry Viéville.

    Dans les années 1… un jeune homme dénommé Isaac N. se prélassait sous un pommier. Soudain une pomme se détacha du pommier et tomba par terre. Ceci amena immédiatement Isaac N. à se poser la question de la reproductibilité du phénomène. Il sortit de sa poche son smartphone et interrogea son IA CIF (Cat I Farted) ; il lui demanda d’analyser tous les vidéos de chute de pommes que l’on trouvait sur Internet et d’en tirer une prédiction sur la chute des pommes. Le résultat, qui consomma une quantité non négligeable d’énergie, semblait incontestable : Avec une probabilité d’erreur inférieure à 10-24, on peut dire que “Lorsque on lâche une pomme, elle tombe“.

    Isaac N. propagea la nouvelle sur les réseaux sociaux et atteignit rapidement plusieurs millions de followers. Certains réitérèrent le procédé en modifiant le prompt : peut-on en tirer la même conclusion pour les poires ou les pêches ?

    Mais soudainement aux USA et en Russie apparurent des groupes contestataires les WON’T FALL (WF), qui défendaient des points de vue plus ou moins nuancés et basés, soi-disant, sur un nouveau type de réseaux neuronaux. Selon eux la thèse de Isaac N. était typiquement issue d’une pensée décadente et Wokiste. Non ! les vraies et bonnes pommes ne tombent pas des arbres, en particulier les pommes cultivées aux USA. Ils admettaient qu’il restait un doute relativement aux pommes du Canada et certains types de pommes rouges, relents d’une pensée communiste dépassée.

    Mais finalement la conclusion d’Isaac N. s’imposa. Ceci eu des conséquences impressionnantes. Comme Issac N. connaissait l’avenir des pommes, il n’eut pas besoin de trouver pourquoi elles tombent. Il n’inventa donc pas la loi de la gravitation universelle. Cette loi qui aurait permis de comprendre le mouvement des astres mais aussi de construire d’incroyables machines. Tout un pan de la science disparut et, par un méandre des technologies, les ordinateurs aussi…

    Mais s’il n’y a plus d’ordinateurs Isaac N. ne peut pas interroger CIF. Il doit donc s’appuyer sur sa très grande Intelligence Naturelle (IN), découvrir la loi de la gravitation universelle et toute cette histoire n’existe pas…

    Stéphane Natkin, Professeur émérite au Cnam

    Illustration. Rubrique-à-brac. L’intégrale, page de garde du tome 1, p. 12 Gotlib © Dargaud, 2017 cité dans : Azélie Fayolle. Isaac Newton dans tous ses états La découverte scientifique par Marcel Gotlib. Arts et Savoirs, 2017, on trouve aussi des précisions à propos de la légende de la pomme, sur Wikipédia. Merci à Dargaud pour leur autorisation.

    Référence. Entretien avec la PDG de Météo-France, Virginie Schwarz, invitée d’Emmanuel Duteil dans l’émission « On arrête pas l’éco », samedi 19 avril, on peut retrouver l’émission de France Inter.

    Note. Ce n’est pas le seul conte autour de ce vieux paradoxe et d’une vision humoristique et prémonitoire de l’IA, dès les années 1970, un des pères de l’informatique française Jacques Arsac, écrivait -pour rire- “Sorbon un générateur automatique de thèses“, qui mettait en scène l’idée d’une intelligence algorithmique qui remplacerait la création humaine, au niveau scientifique.

  • The scientific thinking behind COVID-19 skepticism

    How do COVID-19 skeptics use epidemiological data on social media to advocate against mask mandates and other public health measures? In this article, Crystal Lee proposes the result of an investigation into COVID skeptic social media groups to untangle their practices of data analysis and sense-making. Lonni Besançon

    (la version française est disponible ici)

    Image 1: a social network user presenting his analysis and doubts about the official US data

    You’ve likely seen some version of this conversation in the last few years: a loved one refuses to get vaccinated or claims that the COVID epidemic is completely overblown, pointing to the latest research they saw on Facebook. “I’m the one actually following the science,” they say. “You really should do your own research.” While it’s tempting to brush off these social media posts and conversations as simply unscientific and in need of correction, a six months-long study I conducted with a team of MIT researchers suggests that a simplistic, binary view of science — university researchers are scientific, Facebook posts are not — makes it difficult for us to really understand what makes these anti-mask groups tick. While we do not condone or seek to legitimize these beliefs, our study shows how users in online forums leverage skills and tropes that are the markers of traditional scientific inquiry to oppose public health measures like mask mandates or indoor dining bans. Many of these groups actively employ data visualizations to contradict those made by newspapers and public health organizations, and it can often be difficult to reconcile these discussions around the data (see Image 1). If these users claim to use conventional scientific methods to analyze and interpret publicly available health data, how is it that they come to entirely different conclusions? What is “science” as defined by these groups?

    Image 2 : a user showing his doubts about the origin of the data.

    To answer this question, we conducted a quantitative analysis of half a million tweets and over 41,000 data visualizations alongside an ethnographic study of anti-mask Facebook groups [1]. In the process, we catalogued a series of practices that undergird common arguments against public health recommendations, many of which are skills that scientists might teach their students. In particular, anti-mask groups are critical about the data sources used to make visualizations in data-driven stories (see Image 1 & 2). They often engage in lengthy conversation about the limitations of imperfect data, particularly in a country where testing has been spotty and inefficient. For example, many argue that infection rates are artificially high, as hospitals early in the pandemic were only testing symptomatic individuals. Testing asymptomatic people lowers this statistic, but since asymptomatic people are by definition not physically affected by the virus, this allows users to conclude that the pandemic is not deadly. 

    These anti-mask activists therefore conclude that unreliable statistics cannot be the basis of harmful policies that further isolate people and leave businesses to collapse en masse. Instead of accepting conclusions as is from news media or government organizations, these groups argue that understanding how these metrics are calculated and interpreted is the only way that they will access the unvarnished truth. In fact, to uncover these hidden stories, some deliberately avoided visualizations completely in favor of tables, which they construed as the “rawest,” most unmediated form of data. For many of these groups, following the science is crucial to making informed decisions — but in their view, the data simply doesn’t support public health measures like asking people to wear masks (see Image 3).

    Image 3: a user using data from Sweden to say that government interventions are not justified.


    So what do anti-mask users actually say about the data? From March to September 2020, we conducted a “deep lurking” study of these Facebook groups — based on anthropologist Clifford Geertz’s method of “deep hanging out” — by following comment threads, archiving shared images, and watching live streams where members led tutorials on accessing and analyzing public health data.

    Image 4 : conversations highlighting doubts about how the data is collected (yellow highlighting) and that the data does not support current government policies (blue highlighting).

    So how do these groups diverge from scientific orthodoxy if they are using the same data? We have identified a few sleights of hand that contribute to the broader epistemological crisis we identify between these groups and the majority of scientific researchers. For instance, anti-mask users argue that there is an outsized emphasis on deaths versus cases: if the current datasets are fundamentally subjective and prone to manipulation (e.g., increased levels of faulty testing), then deaths are the only reliable markers of the pandemic’s severity. Even then, these groups believe that deaths are an additionally problematic category because doctors are using a COVID diagnosis as the main cause of death (i.e., people who die because of COVID) when in reality there are other factors at play (i.e., dying with but not because of COVID). Since these categories are subject to human interpretation, especially by those who have a vested interest in reporting as many COVID deaths as possible, these numbers are vastly over-reported, unreliable, and no more significant than the flu.

    Most fundamentally, anti-mask groups mistrust the scientific establishment because they believe that science has been corrupted by profit motives and by progressive politics hellbent on increasing social control. Tobacco companies, they rightly argue, historically funded science that misled the public about whether or not smoking caused cancer. Pharmaceutical companies are in a similar boat: companies like Moderna and Pfizer stand to profit billions from the vaccine, so it is in their interest to maintain a sense of public urgency about the pandemic’s effects. Because of these incentives, these groups argue that these data need to be subject to additional scrutiny and should be considered fundamentally suspect. For scientists and researchers to argue that anti-maskers simply need more scientific literacy is to characterize their approach as inexplicably extreme, which unfortunately leaves anti-maskers with further evidence of the scientific elite’s impulse to condescend to citizens who actually espouse common sense. 


    What solutions are available to avoid these problems?

    • Make exemplarity more visible: the scientific community must always work in a true spirit of ethics and transparency [2], it does so (with rare and sanctioned exceptions) but probably does not show this ethical spirit enough, it should be emphasised more.
    • Make doubt visible: a number of scientists have also said in relation to the COVID data « we don’t know or are not sure » but the media’s treatment of these uncertainties is often biased, it is less media-friendly to say « maybe » than to assert one thing … and then its opposite.
    • Help develop critical thinking: towards both academic science and anti-scientific interpretations of it. Developing a critical mind does not mean saying who is right or wrong, but helping each and every one of us to separate facts from beliefs, to evaluate and deconstruct arguments, not to systematically reject them, but to understand their origins.

    The scientific data of this pandemic and their widely publicised interpretations could be an opportunity to collectively better understand the scientific process with its strength, its limits, and its deviations.

    Crystal Lee

    Références:

    [1] Crystal Lee, Tanya Yang, Gabrielle Inchoco, Graham M. Jones, and Arvind Satyanarayan. 2021. Viral Visualizations: How Coronavirus Skeptics Use Orthodox Data Practices to Promote Unorthodox Science Online. In CHI Conference on Human Factors in Computing Systems (CHI ’21), May 8–13, 2021, Yokohama, Japan. ACM, New York, NY, USA, 18 pages. https://doi.org/10.1145/3411764.3445211

    [2] Besançon, L., Peiffer-Smadja, N., Segalas, C. et al. Open science saves lives: lessons from the COVID-19 pandemic. BMC Med Res Methodol 21, 117 (2021). https://doi.org/10.1186/s12874-021-01304-y


  • Raconte moi un algorithme

    Raconte-moi une histoire par jour… Vous souvenez-vous de cette petite lecture du soir, avant d’aller dormir ? Elle est pour beaucoup d’entre nous une petite madeleine, un souvenir d’enfant, de parent ou de grand-parent. Pour celles et ceux qui, comme nous chez binaire, sont encore de grands enfants, un collectif coordonné par Ana Rechtman Bulajich (Université de Strasbourg)  a préparé le Calendrier Mathématique 2020.

    Cette année, le calendrier propose un jeu mathématique par jour et des textes mensuels, qui ont été confiés à nos camarades de jeu Charlotte Truchet et Serge Abiteboul. Ces histoires d’algorithmes vous transporteront des blockchains aux algorithmes de tri en passant par le web.  Si vous aimez traîner sur le blog binaire, vous adorerez vous plonger dans ces belles histoires d’algorithmes. Au moment de vous endormir, vous ne compterez plus les moutons comme avant…


  • Jean-Marie Hullot, informaticien visionnaire, technologiste exceptionnel

    Jean-Marie Hullo crédit photo Françoise Brenckmann

    Jean-Marie Hullot fut un très grand professionnel de l’informatique. Outre les apports scientifiques du début de sa carrière de chercheur IRIA détaillés plus loin, peu de personnes ont eu des impacts aussi forts et permanents sur l’informatique de Monsieur Tout-le-monde. On lui doit directement les interfaces et interactions graphiques et tactiles modernes, développés d’abord à L’IRIA, puis chez NeXT computers, dont la superbe machine est restée dans les mémoires et a servi en particulier à Tim Berners-Lee pour créer le World Wide Web, et enfin chez Apple à travers le Macintosh et son système MacOSX puis l’iPhone, véritables révolutions dans le domaine qui ont largement engendré le développement de l’informatique conviviale à grande échelle que nous connaissons maintenant, avec en particulier la révolution des smartphones.

    Ces interfaces particulièrement élégantes et intuitives ont marqué une nette rupture avec tout ce qui s’était fait avant, et qu’on a d’ailleurs largement oublié. Il faut bien comprendre qu’elles résultent de la conjonction d’un goût esthétique très sûr et de la création et de la maîtrise de nouvelles architectures de programmation subtiles et éminemment scientifiques, que Jean-Marie Hullot avait commencé à développer lorsqu’il était chercheur à l’IRIA. Un autre apport majeur a été celui des mécanismes de synchronisations d’appareils divers, ici Macs, iPhones et iPads, pour que les calendriers, listes de choses à faire ou autres soient automatiquement à jour dès qu’on les modifie sur un des appareils, sans besoin de la moindre transformation et quels que soient les réseaux utilisés. Cette transparence maintenant habituelle était difficile à réaliser et inconnue ailleurs.  Il faut rappeler que le domaine concerné de l’IHM locale et synchronisée est profond et difficile, et les réussites de ce niveau y sont fort rares. Celle de Jean-Marie Hullot chez NeXT puis Apple, particulièrement brillante, a aussi demandé de très nombreuses interactions avec des designers et surtout directement avec Steve Jobs, dont l’exigence de qualité était légendaire.

    Mais, avant sa carrière industrielle, Jean-Marie Hullot a fait bien d’autres apports scientifiques de premier plan. Après l’École normale supérieure de Saint-Cloud, il  s’est vite passionné pour la programmation, particulièrement en LISP. Cela s’est passé à l’IRCAM où se trouvait alors le seul ordinateur en France vraiment adapté à la recherche en informatique, le PDP-10 exigé par Pierre Boulez pour monter cet institut. S’y trouvaient en particulier Patrick Greussay, auteur de VLISP et fondateur de l’école française de LISP, et Jérôme Chailloux, auteur principal du système Le_Lisp qui a longtemps dominé la scène française de l’Intelligence Artificielle et auquel Hullot a beaucoup participé et apporté.

    Avec sa rencontre avec Gérard Huet, dont il suivait le cours de DEA à Orsay, il rejoint l’IRIA à Rocquencourt pour son travail doctoral. Il débuta sa recherche en réécriture de termes, problématique issue de la logique mathématique et de l’algèbre universelle, et par suite essentielle aux fondements mathématiques de l’informatique. Parti de l’algorithme de complétion décrit dans l’article séminal de Knuth et Bendix, il réalisa un système complet de complétion de théories algébriques, incluant les dernières avancées en traitement des opérateurs commutatifs et associatifs, permettant la transition avec le calcul des bases polynomiales de Gröbner. Le logiciel KB issu de son travail de thèse avait une algorithmique particulièrement soignée, permettant d’expérimenter avec des axiomatisations non triviales, comme par exemple la modélisation canonique des déplacements du robot de l’Université d’Edimbourg. La renommée de ce logiciel lui valut une invitation d’un an comme chercheur invité au Stanford Research Institute en 1980-1981. Là, en tandem avec Gérard Huet, il développa les fondements de la théorie de la réécriture algébrique, alors en balbutiement. Son article Canonical forms and unification, présenté à l’International Conference on Automated Deduction en 1980, présente un résultat fondamental sur la surréduction qui permit d’établir le théorème de complétude de la procédure de narrowing (Term Rewriting Systems, Cambridge University Press 2003, p. 297.)

    Sa thèse de Doctorat à l’Université Paris XI-Orsay Compilation de formes canoniques dans les théories équationnelles fut soutenue le 14 novembre 1980. Point d’orgue de son travail en algèbre effective, elle devint la bible des chercheurs en réécriture, désormais domaine essentiel de l’informatique fondamentale. Elle fut le premier document technique français composé avec le système de composition TeX, alors en développement par Don Knuth à Stanford, où Jean-Marie Hullot s’y était initié. Il était frappé par l’étonnante qualité graphique des documents traités par TeX, mais aussi des écrans bitmap alors développés au laboratoire PARC de Xerox.

    En 1981 il retrouve l’INRIA à Rocquencourt où démarrait le Projet National Sycomore dirigé par Jean Vuillemin, et que venait de rejoindre Jérôme Chailloux, concepteur du langage Le_Lisp. Il y découvrit le premier Macintosh, ordinateur commercial pionnier profitant des avancées de PARC (bitmap display, interface de fenêtres, ethernet) et du SRI (souris). Mais il a vite trouvé la façon dont ses interfaces étaient programmées assez infernale. Comme c’était l’époque de la naissance des langages objets, il a d’abord décidé de développer le sien au-dessus de Le_Lisp, nommé Ceyx, en privilégiant les aspects dynamiques non présents dans les autres langages de l’époque (il est ensuite passé à Objective C, langage du même type mais bien plus efficace.) Ce langage remarquable, dont l’implémentation était un bijou de simplicité et d’intelligence, a servi notamment à Gérard Berry pour écrire son premier compilateur Esterel.

    Ce travail a débouché sur la création du premier générateur d’interfaces mêlant conception graphique directe et programmation simple, SOS Interfaces. C’est en présentant ce système aux idées très originales dans un séminaire à l’université Stanford qu’il a rencontré Steve Jobs, alors chassé d’Apple, et qui a immédiatement souhaité l’embaucher pour créer sa nouvelle machine NeXT. Même si cette machine n’a pas été un succès commercial, elle reste connue comme probablement la plus élégante jamais fabriquée, et a eu le rôle de précurseur de tout ce qui s’est passé ensuite.

    Jean-Marie Hullot a ensuite pris le leadership des interfaces et interactions du nouveau Macintosh en tant que directeur technique du service des applications d’Apple. Ses créations et celles de son équipe marquent toujours l’informatique moderne. Il a ensuite quitté un moment Apple et la Californie pour s’installer à Paris. Là, Steve Jobs l’a rappelé pour régénérer l’esprit créatif d’Apple, mais il a refusé de revenir en Californie, et proposé plutôt de créer un téléphone, ou plutôt un smartphone comme on dit maintenant. Après quelques difficultés pour convaincre Steve Jobs qui n’y croyait pas trop, il a créé l’iPhone dans un laboratoire secret d’une vingtaine de personnes à Paris. La suite est connue, et assez différente de ce que disait Steve Ballmer lors de la première démonstration par Steve Jobs : « Cet objet n’a aucun avenir industriel » ! Avec plus d’un milliard d’exemplaires vendus, il s’agit probablement d’un des plus grands succès esthétiques et industriels de l’histoire.

    En outre, il mena plusieurs entreprises technologiques en France. La société RealNames qu’il a créé en 1996 avait pour objet de doter le réseau Internet alors en plein essor, mais anarchique au niveau du nommage, d’un espace de nommage standardisé. Plus tard, il chercha à créer une infrastructure ouverte pour le partage de photographies, en suivant le modèle de l’encyclopédie libre Wikipedia , et créa la société Photopedia à cet effet. Ces entreprises n’ont pas été pérennes, mais elles ont permis à de nombreux jeunes professionnels de se former aux technologies de pointe, et d’essaimer à leur tour de nouvelles entreprises technologiques.

    Mathématicien créatif, informaticien visionnaire, programmeur élégant, ingénieur rigoureux, technologiste hors-pair, esthète raffiné, Jean-Marie Hullot aura marqué son époque. Les résultats de son travail ont tout simplement changé le monde à tout jamais. La Fondation Iris, qu’il a créé avec sa compagne Françoise et dont l’objectif est de sauvegarder la fragile beauté du monde, continue de porter son message humaniste : http://fondationiris.org/.

    Gérard Berry et Gérard Huet

    Cet article est aussi accessible sur le site Inria.fr


  • David Harel: The limits of computability

    Refusing to choose between science and engineering?

    B: David, what is the result you are the most proud of?

    DH: Besides my five children and five grandchildren, in terms of scientific contribution, I cannot choose between two: a theorem with Ashok Chandra and the software engineering notion of “statechart”.

    The theorem with Ashok in 1979 extends the notion of Turing computability to arbitrary structures. It was coined in database terms originally, but it has been extended by a number of persons, for instance Serge, since then.

    State charts on the other hand are no deep theory. It is a language. State charts are meant for describing complex systems with rich interactions. For languages, the test is in the adoption by people. As they say: “The proof of the pudding is in the eating”. Well, statecharts have been adopted; they are used very broadly, in particular, in popular standards such as UML. The original article I wrote has more than 8000 citations. I believe it worked because it is a simple notion, clean, with some sound inspiration from topology.

    State chart
    Statechart: a small part of a swimming bacteria

    B: Did it take you long to come up with statecharts?

    DH: No! I was consulting for the aircraft industry one day a week. It came out from discussions with engineers in a few weeks. I explained what I understood to Amir Pnueli. I told him this was a simple extension of finite state automaton, nothing deep. He believed it was interesting. He encouraged me to write an article, which I did. It got rejected several times and it took three years before he got published. The lesson: If you think an idea is good, do not give up because they reject your papers. (Laugh of David.)

    David with a statechart (and a little temporal logic), 1984.
    David with a statechart and some temporal logic. 1984.

    Computer science culture

    B: We are big fans of your book “Algorithmics” (in English). Why didn’t you choose that book that is extremely popular as your main contribution?

    DH: I had to choose. But I am happy you brought it up. This is a book that attempts to bring the beauty of algorithms to the masses. The most difficult was to choose what goes in and what not. Our field is still young. It is not easy to see what is fundamental, what will support the test of time. There have been several editions but most of the book did not change much.

    ©Addison-Wesley 1987
    ©Addison-Wesley 1987

    ©Pearson 2004
    ©Pearson 2004

    ©Springer 2012
    ©Springer 2012

    One great experience was also a radio program (in Hebrew) where I explained algorithms in prime time. On radio, your hands are tied. You cannot show diagrams. Still it works. It is possible to explain. People understood; they liked it. Don’t believe those who tell you that explaining computer science is impossible. It is not easy but it can be done.

    B: Who can read your book?

    DH: Anyone with a decent scientific background can understand it. It helps if you know some math such as the polynomials. Otherwise you will miss some of it. But you can understand the main points. For instance, there is the notion of reducibility. You can reduce a problem A to a problem B, or in other words, if I give you an algorithm for A, you can use it to design an algorithm for B. In some sense, I can push reducibility to undecidable problems by some simple logical argument. This sounds crazy: How can you compare undecidable problems? How can you say that an undecidable problem B isn’t more complex than A? They are both undecidable! Well this is not so complicated. If God gives you a solver for A, then with the help of God, you can solve B.

    One contribution in theory, one in engineering, and one for cultural education! This is another form of completeness? (Laugh of David.)

    David Harel et Maurice Nivat
    David Harel and Maurice Nivat

    Computer science education

    Computer science education is one favorite topic of Binaire. Do you think computer science should be taught in school?

    I was involved in the Israel curriculum. In Israel, all kids have to learn computer science in school. We used to teach them only to write code and it was not satisfactory. We came up with the concept of “zipper”: one bit of theory, one bit of practice, one bit of theory, and so on. There are two levels. The first one is for every student, the basis of computing and practice by programming – now I think it is in Java. The second one, more advanced, develops notions such as finite state automata.

    It is important to teach them what Janet Wing calls “computational thinking”. This is becoming an essential way of thinking. You need it all the time, for instance to organize your life, to schedule your activities.

    Suppose you are moving. You ask your friends to come and help you. They come with cars of different sizes, some minibus perhaps. You have to optimize placing your boxes in the car. I don’t know whether it helps you to know that the problem is NP-hard. But it does help to know dynamic programming. This is not mathematics! You have to perform intellectual activities that are possibly very complex. This is computer science!

    By the way, classical algorithms do not suffice. You have to understand complex systems, with rich interactions between them, with interaction with humans. We also have to teach that in school.

    Elephant, Wikipedia
    Elephant, Wikipedia

    The elephant test and the completeness of natural systems

    B: We heard you ask the question in a talk on the Web (URL) “When can we say that we have built a model of nature”. Can you explain that question to Binaire audience?

    DH: This is the idea of extending the Turing test to the simulation of complex systems such as the weather, or a heart. For instance, let us consider an elephant. Say you want to model an elephant. When can you say you understand everything about the elephant? When you have built a model that cannot be distinguished from the real thing. But who cannot distinguish? The best experts in the field. You have to decide a level of details. You also decide the lab environment because the goal is not to build an elephant but to simulate it. Then I implement a simulator. At some point, I am done, for this level of details! Suppose my simulator passes the test.

    Now compare that to the Turing test. Suppose Serge’s laptop passes the Turing test. Then his laptop is intelligent, forever. Now, if my program passes the Elephant test, it just means that the best scientists today consider this is a perfect model of an elephant. But if someone tomorrow produces some new knowledge about elephants, this may change the story. My program may fail. This is fantastic. This is the progress of science. This is Einstein reaching beyond Newton, and other scientists reaching beyond Einstein.

    I have encountered that very situation. For example, we built a model of some biological cells. A researcher didn’t like some particular aspect of our model. He did some research and showed some shortcomings. Awesome! A new challenge, and science progresses! When you want to model complex biological objects, or very complex systems such as the weather, there is no way to completeness that we can foresee.

    Wise computing

    B: Now tell us about what you are currently working on?

    DH: I call it “wise computing”. It is not just writing programs. It is not just intelligent computers writing programs for you. It is you developing software together with the machine. We are used to tell the machine what to do. I would like the machine to participate! The computer can verify what I propose, clean up, and fix bugs. But I would like it to also detect issues, ask questions, and make suggestions. What we achieve is still limited but we are making progress.

    Le géant Orion portant sur ses épaules son serviteur Cedalion (Wikipedia)
    The giant Orion carrying his servant Cedalion (Wikipedia)

    A dwarf on the shoulder of a giant

    B: What would you like to say, David, as conclusion?

    DH: I would like to come back to Turing. He is a giant. I worked on extensions of Turing computability, of the Turing test, on some biology problems following his works on morphogenesis. I felt all my life as a dwarf on the shoulder of a giant. It takes years to establish a science. Some people still believe that computer science is not a deep science, fewer and fewer though. Just wait some more years… Turing will reach the pantheon of sciences, with icons such as Einstein, Darwin or Freud.

    David Harel (URL), Weizmann Institute


    In memory of Ashok Chandra

    Ashok Chandra
    Ashok Chandra

    David Harel and Binaire are dedicating this interview to the memory of David’s colleague and friend Ashok Chandra who passed away in 2014.

    Ashok K. Chandra was a computer scientist at Microsoft Research, where he was a general manager at the Internet Services Research Center in Mountain View, after having been Director of Database and Distributed Systems at IBM Almaden Research Center. Chandra co-authored several key papers in theoretical computer science. Among other contributions, he introduced alternating Turing machines in computational complexity (with Dexter Kozen and Larry Stockmeyer), conjunctive queries in databases (with Philip M. Merlin), computable queries (with David Harel), and multiparty communication complexity (with Merrick L. Furst

  • Susan McGregor, journalist and computer scientist

    A new “entretien de la SIF”. Claire Mathieu and Serge Abiteboul interview Susan McGregor  who is Assistant Professor at Columbia University  and Assistant Director of the Tow Center for Digital Journalism. Besides being a journalist, Susan is also a computer scientist. So, she is really the person to ask about the impact of computer science on journalism.

    smg

    Professor McGregor © Susan McGregor

    B: Susan, who are you?
    S: I am assistant professor at the Columbia Graduate School of Journalism and the Assistant Director of the Tow Center for Digital Journalism there. I had a longterm interest in non-fiction writing and got involved in journalism in university, but my academic background is in computer science, information visualization, and educational technology. Prior to joining Columbia, I was the Senior Programmer on the News Graphics team at The Wall Street for four years, and before that was at a start up specializing in real-time event photography. Though I’ve always worked as a programmer, it has always been as a programmer on design teams. Design teams can be a challenge if you come from computer science, because there is a tension between the tendencies of programming and design. Programming prioritizes modular, reusable components and general solutions, while designs should always be as specific to the given situation as possible. My interest in visualization and usability began during a gap year between secondary school and university, part of which I spent working in an administrative role at a large corporation. I observed how incredibly frustrated my co-workers (who were not tech people) were with their computers. Thanks to a CS course I had taken in secondary school I could see places where the software “design” was really just reflecting the underlying technology. Interface decisions – which are essentially communication decisions – were being driven by the technology rather than the user or the task.

    Computer science literacy is essential for journalists…

    B: How much computer science do you think a good journalist needs to know nowadays?
    S: Computer literacy is essential for journalists; in fact, there are enough ways that computer science is important to journalism that a few years ago we began offering a dual-degree program in computer science and journalism at Columbia.

    First, journalists must understand digital privacy and security because they have an obligation to protect their sources, so understanding how email and phone metadata can be used to identify those sources is essential. Second – and probably best known – are the roles in newsrooms for those with the engineering skills to build to the tools, platforms and visualizations that are key to the evolving world of digital publishing. Third, computer science concepts like algorithms and machine learning are now a part of nearly every product, service and industry, and influence many areas of public interest. For instance, credit card offers and mortgages are being made available according to algorithms, so understanding their potential for power and bias is crucial to assessing their impact on civil rights. In order to accurately and effectively report on technology in general, more journalists need to understand how these systems work and what they can do. Right now, technology is often covered more from a consumer perspective than from a science perspective. Since joining Columbia, I’ve become more directly aware of the tensions between scientists and journalists. Scientists want their work covered but are rarely happy with the result. Journalists need better scientific understanding, but scientists should also consider putting more effort into their communications with those outside the field. Scientific papers are written for scientific audiences; providing an additional text with more of a focus on accessibility could improve both the quality and reach of science journalism.

    … but journalists are essential for people to be informed

    B: How do you view the future of journalism given the evolution of computer science in society ?
    S: Journalism is increasingly collaborative, with citizen journalists, crowd sourcing of information, and more direct audience interaction. That is a big change from even fifteen years ago! That will continue, though I think we will also see a return to more classic forms, with more in-depth reporting. The Internet has given rise to a lot more content than we used to have, but not necessarily more original reporting. Even if you believe that it requires no special talent or training to be a journalist, you cannot get away from the fact that original reporting takes time. Finding sources takes time; conducting interviews takes time. And while computers can do incredible number-crunching, the kind of inference essential to finding and reporting worthwhile stories is still something that people do better than computers.

    smg2

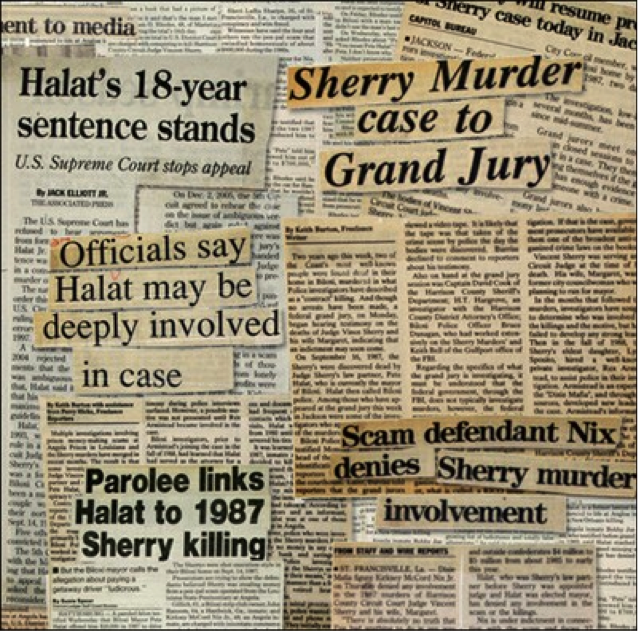
    Newspaper clip, ©FBI

    B: As a journalist, what do you think of natural language processing for extraction of knowledge from text?
    S: From what I understand of those particular topics, the most promising prospect for journalists is knowledge collation and discovery. Until only a few years ago, news organizations often had library departments and librarians, and you started a new story or beat by reviewing the “clip file”. That does not exist any more, because most of the archives are digital, and because there isn’t typically a department dedicated to indexing articles in the same way. But if NLP (Natural Language Processing) and entity resolution could help us meaningfully connect coverage across time and sections, it could be a whole new kind of clip file.  Many news organization are sitting on decades of coverage without really effective ways to mine and access all that knowledge.

    B: How do you define “reporting”?
    S: The scientific equivalent of reporting is conducting an experiment or observational study; generating new results or observations. Reporting involves direct observation, interviews, data gathering, media production and analysis. Today, one frequently sees variations of the same news item on different outlets, but they are all based on the same reporting; the volume of content is going up, but the volume of original information is not necessarily increasing. For example, while covering the presidential election in 2008, I learned that virtually all news organizations get their elections data from the Associated Press. Many of these news outlets produce their own maps and charts on election day, but all the news organizations are working from the same data at the same time. It may look diverse, but the source material is identical. Nowadays, you often have several news organizations covering an issue where, realistically, one or two will do. In those cases, I think the others should focus their efforts on underrepresented topics. That’s what we really need: more original reporting and less repetition.

    B: You could probably also say that for science. As soon as someone has an interesting idea, everyone flocks to it and repeats it. Now, as a journalist, what do you think of big data analysis?
    S: “Big data” is a pretty poorly defined term, encompassing everything from statistics to machine learning, depending on who you ask. The data used in journalism is almost always very small by anybody’s standards. Data-driven journalism, however, is an important and growing part of the field. In the US, we now have outlets based exclusively on data journalism. The popularity of data journalism stems in part, I think, from the fact that the American ideal of journalism is “objective,” and we have a culturally deep-seated notion, carried over from science, that numbers and data are objective, that they embody a truth that is unbiased and apolitical. But what is data? Data is the answer to someone else’s interview questions. Well, what were that person’s motivations? You must be critical of that. Skepticism is a necessary component of journalism, as a profession. At some level you never fully believe any source and such skepticism must extend to data. Corroboration of and context for data are essential.

    To me this is also a key point about data and data analysis in journalism: data analysis alone is not journalism. You have to first understand and then present the data’s significance in a way that is relevant and meaningful to your audience. Take food prices, for example. We have good data on that. What if I wrote an article saying that Gala apples were selling for 43 dollars a barrel yesterday? It is a fact – and in that sense “true.” But unless I also include what a barrel cost last week, last month, or last year, it’s meaningless. Is 43 dollars a barrel a lot, or a little? And if I don’t include expert perspectives on why Gala apples sold for 43 dollars a barrel yesterday, it’s not actionable. At its best, journalism provides information with which people can make better decisions about their lives. Without the why it is statistics, not journalism.

    Communication, education, and computer technology

    smg3

    Discovery of early homo sapien skulls in Herto, Ethiopia, ©Bradshaw Foundation

    B- Sometimes we are frustrated that journalists write so little about critical advances in computer science and, in comparison, so much about discoveries of new bones in Africa, for example.
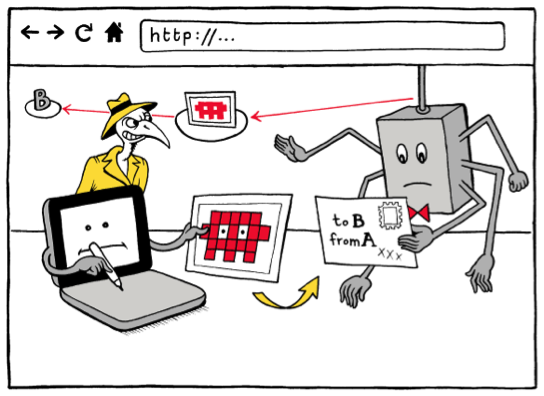
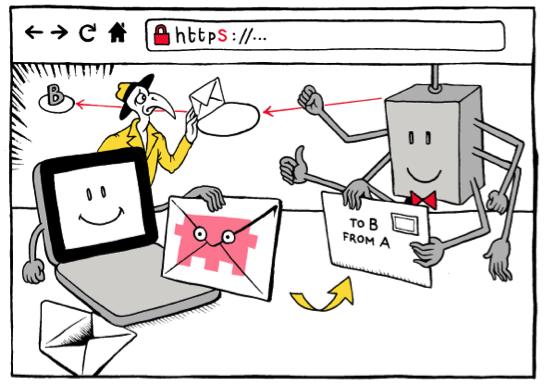
    S- Humans are visual creatures. Bones in Africa, you can take pictures. But research discoveries in CS, often they’re not visual. Vision is humans’ highest bandwidth sense, and we know that readers are drawn to visuals in text. I have a pet hypothesis that visualizations can be used, essentially, to turn concepts into episodic memories – as, for example, iconic images, or political propaganda and cartoons do. And because visuals can be consumed at a glance and remembered (relatively) easily, ideas with associated visuals are easier to spread. This is one reason why visuals have been a part of my work on digital security from the beginning.

    smg41smg42

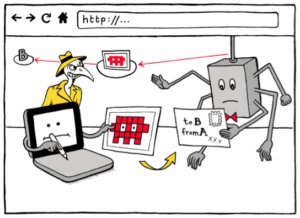
    http vs. https, visualized. © Matteo Farinella & Susan McGregor

    B: Speaking of education theory, what do you think of MOOCs (*) ?
    S – I doubt MOOCs will persist in their current form, because right now we’re essentially just duplicating the university model online. But I do think that the techniques and technologies being developed through MOOCs will influence regular teaching methods, and there will be an increase in self-organized informal learning.  Online videos have and will continue to change education. Interactive exercises with built-in evaluations will continue to be important. Classrooms will be less the place where lectures happen and more where questions get asked. Of course, that possibility is dependent on universal access to good quality internet connections, which is not yet a reality even in many parts of the United States.

    Computer science literacy is essential for everyone.

    B- What do you think of computer science education at the primary school level?
    S – Computational thinking is required literacy for the 21st century. I am not sure how new that idea is: Seymour Papert’s “objects to think with” approach to constructivist education and the development of the Logo programming language happened nearly fifty years ago. I started playing with Logo in primary school, when I was eight. To consider computational thinking a necessary literacy is uncontroversial to me. I can even imagine basic programming used as a method of teaching math. Because I teach adult journalists, I do the reverse: I use story to teach programming.

    For example, when I teach my students javascript, I teach it as “language,” not as “computing.” That is, I draw a parallel from natural language writing to writing a program. For example, in journalism there is a convention about introducing a new character. When someone is first named in an article, you say something to describe them, such as: “Mr Smith, a 34 year old plumber from Indiana”. Well, that is a variable declaration!  Otherwise, if you later refer to Smith without having introduced him, people would not know who you are talking about. The way in which computers “read” programs, especially these very simple programs, is very similar to the way humans read text. You could extend the analogy: the idea of a hyperlink is like including an external library, and so on. The basic grammar of most programming languages is really quite simple compared to the grammar of a natural language: you have conditionals, loops, functions – that is about all.

    smg6

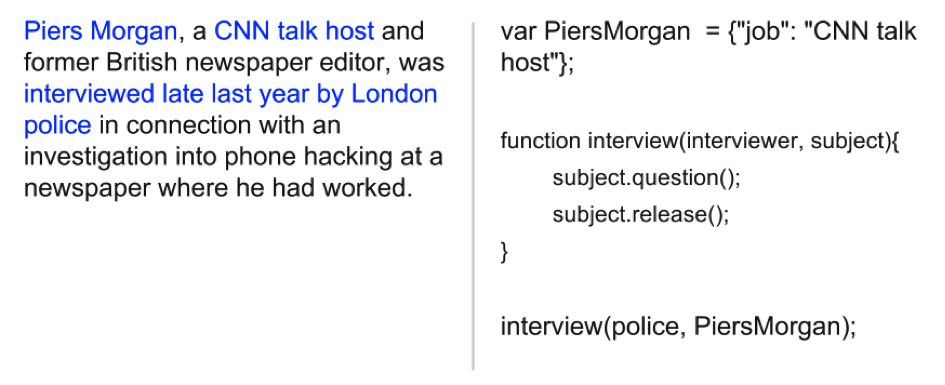
    Sample slide from “Teaching JavaScript as a natural language” presentation delivered at BrooklynJS, February 2014.

    B: One last question: what do you think of the Binaire blog? Do you have any advice for us?
    S- The time to load the pages is too long. For most news organizations, an increasing proportion of visitor traffic is coming from mobile. The system should sense that the reader has low bandwidth and adapt to it.

    B- Is there anything else you would like to add?
    S- When it comes to computer science programming and technology, to the audiences who may not be familiar with it, I like to say: you can do it! Douglas Rushkoff once drew a great parallel between programming and driving, and it probably takes the same level of effort to reach basic competency with each. But one big difference is that we see people – all different kinds of people – driving, all the time. Computer science and programming, meanwhile, are invisible, and the people given the most visibility in these fields tend to look alike. Yet they are both arguably essential skills in today’s world. If you want to be able to choose your destination, you must learn to drive a car. Well, in this day and age, if you want to be able to direct yourself in the world, you must learn to think computationally.

    Explore computational thinking. You can do it!

    Susan McGregor, Columbia University

    (*) Mooc, Massive online courses. In French, Flot, Formation en ligne ouverte